A friend of mine and I went out for drinks recently. While we were speaking about politics, economics and how to solve the future... he gave me a great idea for a use for something I've been messing around with.
The HistoryWealth Distribution - how we compareSome short time ago I was doing some research on wealth distribution. I wanted to come up with a way of comparing countries directly.
Recently, I heard a talk from Paul Krugman, a Professor of Economics from Princeton University. In fact, I've
written on that talk before.
What had stuck in my head from Krugman's talk was the issue of "wealth spread" and "fairness" within an economy - we should have a way of comparing different economies directly.
More specifically - while I "know" from common understanding that the US economy has become much less evenly spread over the last couple of decades, and many of the Scandinavian countries have maintained their even equality of wealth - I wanted to be able to calculate the situation more accurately; to clearly measure and compare the different economies; possibly work out where Australia is on that scale, right now.
I looked around and couldn't find any consensus on the issue - no standard way of measuring what I wanted to measure.
After some hunting around and a little experimenting I came up with with a basic model/system of my own.
Now at that point I had no idea what to do with it. It was interesting to me and I liked to see the results - but I couldn't see what the practical upshot of it could ever be to anyone.
And this is where my drinks with Simon come into it. He gave me the idea of what to do with it while we were talking that night.
Why do we so easily measure a country's health and value by:
- GDP Growth
- Interest Rates
- Inflation
- Unemployment Rates
- Stock market values
Why can't we talk about "Spread of Wealth", "Long term vs Short Term Unemployment", "Ease of Basic Living"... the simple reason, I would hypothesise, is because GDP, Interest Rates, Inflation and Unemployment all have
single numbers attached to them - and the Stock market has the "bourse" value (e.g. ASX200, FTSE, Nasdaq etc.)
All the other issues (Spread of Wealth etc.) have no
single number that can be associated with them - and therefore can't be summarised as easily.
One example in support of this theory is the topic of "housing afford-ability". Until recently, in Australia, the issue had never been discussed widely. In order to have the conversation about it - in order to make it news worthy - we needed a specific housing afford-ability index, so that we could compare States with each other, record whether it's gone up or down and by how much... and generally discuss the issues using simple concepts. That's what we did. We made a "housing afford-ability index".
And so... the idea that came out of my discussion with Simon is this:
If we want to have a discussion about "fairness" and the "spread of wealth" in our economy, then we need a fairness bourse... a wealth spread index; a
single number that can be compared between economies and over time within an economy.
So - let's make one.
The overview
The original ideas
Using data easily available, I wanted to find a value that would vary within a known range (say 0 to 100) and that would represent the level of inequality within an economy.
So allowing for the idea that the "worst" possible economy is one in which the bottom 60% of the population own nothing at all and the "best" economy is one in which everyone owns a completely equal share of the wealth - it was fairly simple to come up with a reasonably basic way of scoring economies within the given range.
With a tip of the hat to Ghandi's/Churchill's/Truman's quote (see many confused references to this quote across the internet -
Florida Today,
Ask MetaFilter,
Memorable Quotations,
Askville to list a few):
"A nation's greatness is measured by how it treats its weakest members"
the formula I used gives more weight to the fairness imparted on the bottom feeders than the big end of town. So while an economy could improve its rating by decreasing the amount of wealth that is "soaked up" by the richest people, it will improve its index value far more quickly by improving the lot of its worst off inhabitants.
Here are the initial results:

All of the initial results were between the values 57.5 (Turkey) and 77 (Slovakia) (represented by the red bars).
These values can, alternatively, be viewed by stretching them out between 0 and 100 so that the lowest scoring economy always receives a score of 0 and the highest 100 (represented by the blue bars).
Some notable scores amongst the list are:
- America - 23.08
- New Zealand - 38.46
- I was surprised by how low NZ scored
- United Kingdom - 38.46
- Australia - 53.85
- France - 64.10
- Sweden - 87.18
- Japan & The Czech Republic - 94.44
On a comparative basis - I think this system of scoring shows some merit and represents a step forward in finding a single value to represent the spread of wealth within an economy.
However both systems show some limitations.
The first version, with values between 57.5 and 77, show little absolute variance and gives the mistaken impression that there isn't much difference between these economies in the terms being measured.
The second version with values between 0 and 100, tries to deal with that limitation, but suffers from, or emphasises, a few more:
- it stretches out values at the bottom of the range and compresses values at the top
- it could make countries in the lower values appear as if they were improving or slipping faster than they are
- it could mask improvements/drops in countries with higher values by making the changes seem smaller than they are
- one country slipping at the bottom or the top could make the others appear as if they were improving when they weren't
- one country improving at the bottom or the top could make all the others appear as if they were slipping when they weren't
The final solution
It soon became clear why these systems each had these particular problems.
They treated "100" as an attainable goal, as if the "perfectly fair" society was something reachable.
In order to make the scale work like a normal bourse, the "perfect" solution needed to remain something unattainable. Something that everyone aims for, but no one can ever reach - stretching into infinity.
Taking this into account allowed me to calculate these values:
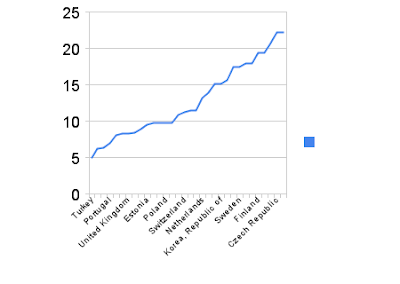
The final results varied from 5.0 up to 22.23 and will increase in rate of growth (approaching infinity) as the economies being measured approach "perfect".
Some notable scores amongst the list are:
- America - 6.2
- New Zealand - 8.26
- United Kingdom - 8.26
- Australia - 8.9
- France - 11.5
- Sweden - 17.4
- Japan & The Czech Republic - 22.23
The DetailsAll calculations were based on details of the relevant economies from this UNICEF web site:
http://www.unicef.org/infobycountry/industrialized.htmlThe calculations are based on 2 main values:- Low = the % of the nations wealth held by the bottom 40% of the population
- High = the % of the nations wealth held by the top 20% of the population
The accuracy of the figures, and how up-to-date they are are somewhat irrelevant at this point. The point was, and is, to come up with a reliable, convenient and illuminating way of measuring an economies fairness.
The values actually used were as follows:
| Country | Low | High |
| Australia | 18 | 41 |
| Austria | 22 | 38 |
| Belgium | 22 | 41 |
| Canada | 20 | 40 |
| Czech Republic | 25 | 36 |
| Denmark | 23 | 36 |
| Estonia | 19 | 43 |
| Finland | 24 | 37 |
| France | 20 | 40 |
| Germany | 22 | 37 |
| Greece | 19 | 42 |
| Hungary | 23 | 37 |
| Ireland | 20 | 42 |
| Israel | 16 | 45 |
| Italy | 19 | 42 |
| Japan | 25 | 36 |
| Korea, Republic of | 22 | 38 |
| Latvia | 18 | 45 |
| Lithuania | 18 | 43 |
| Netherlands | 21 | 39 |
| New Zealand | 18 | 44 |
| Norway | 24 | 37 |
| Poland | 19 | 42 |
| Portugal | 17 | 46 |
| Slovakia | 24 | 35 |
| Slovenia | 23 | 36 |
| Spain | 19 | 42 |
| Sweden | 23 | 37 |
| Switzerland | 20 | 41 |
| Turkey | 15 | 50 |
| United Kingdom | 18 | 44 |
| United States of America | 16 | 46 |
The Final ResultsThe fairness values calculated, in order form "worst" to "best", were as follows:
| Turkey | 5 |
| United States of America | 6.2 |
| Israel | 6.3469387755102 |
| Portugal | 7 |
| Latvia | 8.06382978723404 |
| New Zealand | 8.26086956521739 |
| United Kingdom | 8.26086956521739 |
| Lithuania | 8.46666666666667 |
| Australia | 8.90697674418605 |
| Estonia | 9.5 |
| Greece | 9.74418604651163 |
| Italy | 9.74418604651163 |
| Poland | 9.74418604651163 |
| Spain | 9.74418604651163 |
| Ireland | 10.9047619047619 |
| Switzerland | 11.1951219512195 |
| Canada | 11.5 |
| France | 11.5 |
| Netherlands | 13.2105263157895 |
| Belgium | 13.9230769230769 |
| Austria | 15.1666666666667 |
| Korea, Republic of | 15.1666666666667 |
| Germany | 15.6285714285714 |
| Hungary | 17.4117647058824 |
| Sweden | 17.4117647058824 |
| Denmark | 17.969696969697 |
| Slovenia | 17.969696969697 |
| Finland | 19.3636363636364 |
| Norway | 19.3636363636364 |
| Slovakia | 20.6774193548387 |
| Czech Republic | 22.2258064516129 |
| Japan | 22.2258064516129 |
The Final CalculationThe calculation used was as follows:((100 - High) + Low^2)/((High - 20) + (40 - Low))
The ReasoningThe reasoning is as follows:
- The value of "High" varies between 20 -> 100
- The value of "Low" varies between 0 -> 40
- In the "perfect" situation - High = 20, Low = 40
- (High - 20) + (40 - Low) = 0
- In the "worst" situation - High = 100, Low = 0
- (High - 20) + (40 - Low) = 120
- The inverse of (High - 20) + (40 - Low)
- maximum (infinity) in the "perfect" situation
- minimum (1/120) in the "worst" situation
- To further increase the exponential effect of both "High" and "Low" (but particularly of "Low") multiply the above calculation by ((100 - High) + Low^2)
And you are left with final calculation:((100 - High) + Low^2)/((High - 20) + (40 - Low))
The ConclusionAfter some experimentation and testing with varying values around the current "correct" values, I am convinced that this is a valuable way of calculating the over-all fairness of an economy.
I would be very interested to hear any feedback, comments or findings related to the calculation - how its adoption could be encouraged, and what might improve its usefulness.


